
Ecological Stability Emerges at the Level of Strains in the Human Gut Microbiome
We are delighted to share that our paper entitled Ecological Stability Emerges at the Level of Strains in the Human Gut Microbiome is now accepted at mBio! This work is with the very talented first author and PhD student Richard Wolff and postdoc William Shoemaker.
In healthy hosts, species abundance fluctuations in the microbiome have been frequently described as stable, and these fluctuations can be described by macroecological laws. However, it is less clear how strain abundances change over time. An open question is whether individual strains behave like species themselves, exhibiting stability and following the macroecological relationships known to hold at the species level, or whether strains have different dynamics, perhaps due to the relatively close phylogenetic relatedness of co-colonizing lineages. Here, we analyze the daily dynamics of intra-specific genetic variation in the gut microbiomes of four healthy, densely longitudinally sampled hosts. First, we find that overall genetic diversity in a large majority of species is stationary over time, despite short-term fluctuations. Next, we show that fluctuations in abundances in approximately 80% of strains analyzed can be predicted with a stochastic logistic model (SLM)—an ecological model of a population experiencing environmental fluctuations around a fixed carrying capacity which has previously been shown to capture statistical properties of species abundance fluctuations. The success of this model indicates that strain abundances typically fluctuate around a fixed carrying capacity, suggesting that most strains are dynamically Finally, we find that the strain abundances follow several empirical macroecological laws known to hold at the species level. Together, our results suggest that macroecological properties of the human gut microbiome, including its stability, emerge at the level of strains.

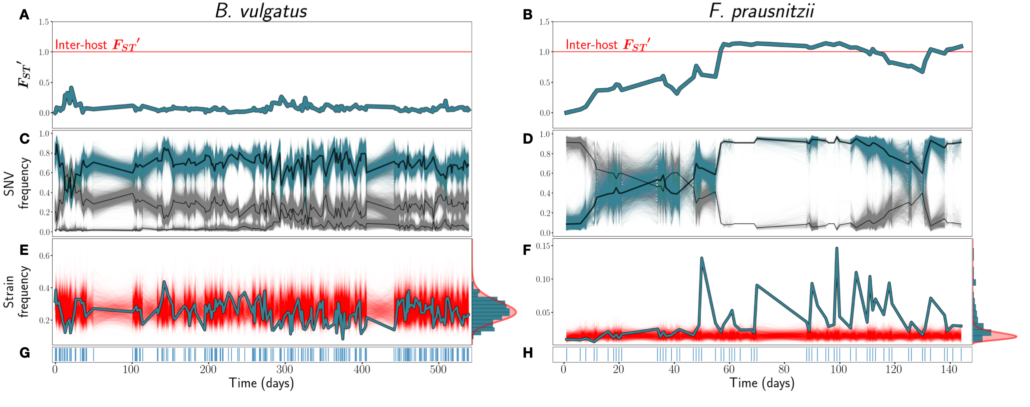
Figure from the paper: Figure 1: A & B) FST ′ trajectories for B. vulgatus (am) and F. prausnitzii (ao), respectively. C & D): SNV frequencies of three inferred strains for B. vulgatus (C) and two inferred strains for F. prauznitzii (D). In black are the inferred strain trajectories. Highlighted in blue are example strains featured further in (E) and (F). E & F) Frequencies of the example strains in blue, with simulations of the corresponding SLM overlaid in red. At right, the empirical distribution of strain abundances is plotted in blue, and the stationary Gamma distribution of abundances (see Equation 2) predicted by the SLM in red. G & H) Sampling time points. Blue lines indicate that a sample was taken on that day.

